Surprising Stats From Mining One Million Tweets About #Syria

I’ve been filtering Twitter’s firehose for tweets about “#Syria” for about the past week in order to accumulate a sizable volume of data about an important current event. As of Friday, I noticed that the tally has surpassed one million tweets, so it seemed to be a good time to apply some techniques from Mining the Social Web and explore the data.
While some of the findings from a preliminary analysis confirm common intuition, others are a bit surprising. The remainder of this post explores the tweets with a cursory analysis addressing the “Who?, What?, Where?, and When?” of what’s in the data.
If you haven’t been keeping up with the news about what’s happening in Syria, you might benefit from a piece by the Washington Post entitled 9 questions about Syria you were too embarrassed to ask as helpful background knowledge.
Filtering the Firehose
In addition to an introduction for mining Twitter data that’s presented in Chapter 1 (Mining Twitter) of Mining the Social Web, 2nd Edition, a cookbook of more than two dozen recipes for mining Twitter data is featured in Chapter 9 (Twitter Cookbook.) The recipes are fairly atomic and designed to be composed as simple building blocks that can be copied, pasted, minimally massaged in order to get you on your way. (In a nutshell, that’s actually the purpose of the entire book for the broader social web: to give you the tools that you need to transform curiosity into insight as quickly and easily as possible.)
You can adapt concepts from three primary recipes to filter and archive tweets from Twitter’s firehose:
- Accessing Twitter’s API for Development Purposes (Example 9-1)
- Saving and Accessing JSON Data with MongoDB (Example 9-7)
- Sampling the Twitter Firehose with the Streaming API (Example 9-8)
Although there is a little bit of extra robustness you may want to add to the code for certain exceptional circumstances, the essence of the combined recipes is quite simple as expressed in the following Python code example:
import twitter
import pymongo

# Our query of interest
q = '#Syria'

# See Example 9-1 (Accessing Twitter's API...) for API access
twitter_stream = twitter.TwitterStream(auth=twitter.oauth.OAuth(...))

# See https://dev.twitter.com/docs/streaming-apis for more options
# in filtering the firehose
stream = twitter_stream.statuses.filter(track=q)

# Connect to the database
client = pymongo.MongoClient()
db = client["StreamingTweets"]

# Read tweets from the stream and store them to the database
for tweet in stream:
    db["Syria"].insert(tweet)
In other words, you just request authorization, filter the public stream for a search term, and stash away the results to a convenient medium like MongoDB. It really is that easy! In just over a week, I’ve collected in excess one million tweets (and counting) using exactly this approach, and you could do the very same thing for any particular topic that interests you. See the IPython Notebook featuring the Twitter Cookbook for all of the finer details.)
As discussed at length in Chapter 1 of Mining the Social Web, there is roughly 5KB of metadata that accompanies those 140 characters that you commonly think of as a tweet! A few of the metadata fields that we’ll leverage as part of exploring the data in this post include:
- Who: The author’s screen name and language
- What: Tweet entities such as #hashtags, @mentions, and URLs
- Where: Geo-Coordinates for where the tweet was authored
- When: The date and time the tweet was authored
Of course, there are some other details tucked away in the 5KB of metadata that could also be useful, but we’ll limit ourselves to just using these fields for this post. The goal is just to do some initial exploration and compute some basic statistics as opposed to compute anything scholarly or definitive.
…there is roughly 5KB of metadata that accompanies those 140 characters that you commonly think of as a tweet…
The remainder of this section presents some of the initial findings from mining the data with Python and techniques from the social web mining toolbox.
Who?
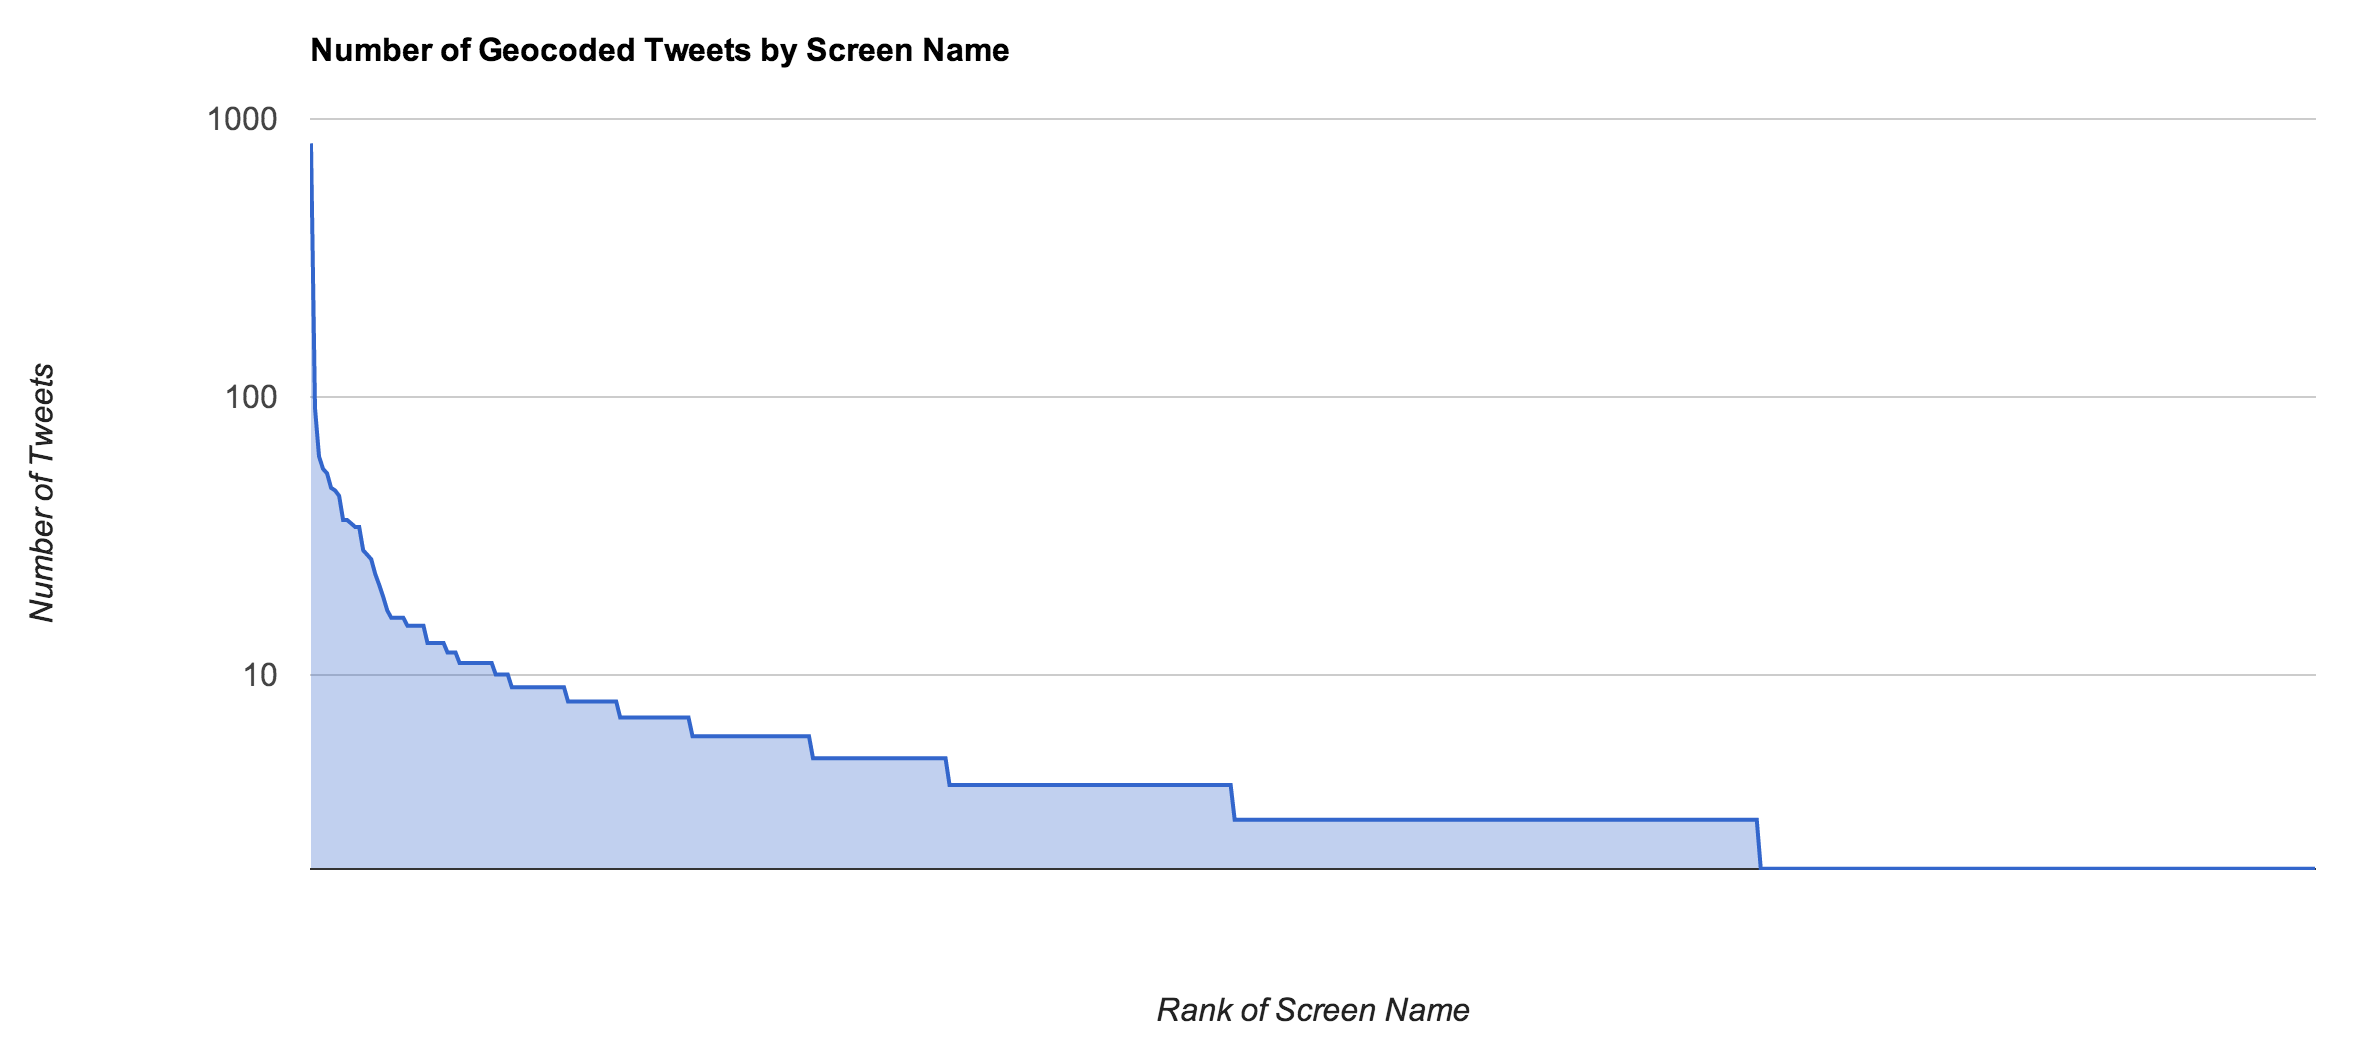
The underlying frequency distribution for the authors of the tweets reveals that there just over 305,000 accounts that have contributed the 1.1 million tweets in the data set. The underlying frequency distribution shown below reveals a long tail with certain accounts at the head of the curve contributing highly disproportionate numbers to the overall aggregate.

The frequency distribution for authors contributing tweets about #Syria reveals a long tail with certain accounts contributing highly disproportionate numbers of tweets. The x-axis is the rank of each screen name in descending order of frequency, and the y-axis is the number of tweets authored by that screen name.
A closer inspection of the accounts contributing disproportionate numbers of tweets reveals that the top accounts (such as RT3Syria as shown below) appear to be bots that are retweeting anything and everything about Syria. This finding makes sense given that it is unlikely that any human being could author hundreds of meaningful tweets a day.
On the chart, notice that at around the 100,000th rank, the number of tweets per author reaches one, which means that 200,000 of the 1.1 million tweets are accounted for by 200,000 unique accounts while the other 900,000 tweets are shared amongst the remaining 100,000 accounts. In aggregate, this means that about 80% of the content is accounted for by one-third of the contributing accounts!
A table below displays the frequency information for any screen name contributing more than 1,000 tweets in case you’d like to further investigate these accounts that sit at the head of the curve.
| Screen Name | Frequency |
|---|---|
| RT3Syria | 4068 |
| SyriaTweetEn | 3546 |
| irane_Azad | 3146 |
| Neda30 | 2339 |
| AzadiIran92 | 2164 |
| FreeIran9292 | 2123 |
| IraneAzad_92 | 2062 |
| Logunov_Daniil | 2053 |
| Abdirizak2327 | 1940 |
| tintin1957 | 1801 |
| SyrianRevo | 1657 |
| kokoyxx_xxx2903 | 1646 |
| RT3Iraq | 1644 |
| 4VictoryInIran | 1592 |
| shiiraaryare | 1572 |
| ILA_2013 | 1537 |
| FreeMyIran | 1487 |
| dictatorpost | 1434 |
| AajelSyria | 1422 |
| Mojahedineng | 1354 |
| NewIranFree | 1314 |
| TheVoiceArtist | 1303 |
| EqlF07 | 1302 |
| 17febpage | 1288 |
| YallaSouriya | 1256 |
| mog7546 | 1246 |
| KalamoonNews | 1239 |
| Iran1392Azad | 1225 |
| USRadioNews | 1191 |
| Opshy | 1181 |
| RobotsforObama | 1175 |
| Victory92Iran1 | 1143 |
| ErwinFilbert | 1103 |
| FamousDraft | 1086 |
| SyriaTwitte | 1079 |
| Iran1392Victory | 1067 |
| AnonAlgeria | 1064 |
| monitor_view | 1015 |
| HistoryWhite | 1012 |
| watchman_A9 | 1009 |
Another interesting aspect of exploring who is contributing to #Syria tweets is to examine the language of the person who is tweeting. The following chart show that the vast majority of the tweets are written in English and Arabic. However, an separate breakdown excluding English and Arabic is also provided to gist the representation from other languages.

The vast majority of tweets about #Syria are written in English with Arabic coming in second place with around 8.5%.

A breakdown of the ~33,000 tweets that were not written in English or Arabic.
For curiosity’s sake, the following table conveys frequency information for any language that appeared more than 100 times across the 1.1 million tweets.
| Language | Frequency |
|---|---|
| English | 985437 |
| Arabic | 94777 |
| Spanish | 6733 |
| German | 5247 |
| Indonesian | 4500 |
| French | 3342 |
| Turkish | 2400 |
| Slovak | 2313 |
| Italian | 2228 |
| Japanese | 1036 |
| Vietnamese | 967 |
| Russian | 869 |
| Polish | 801 |
| Dutch | 643 |
| Greek | 469 |
| Slovenian | 421 |
| Danish | 419 |
| Urdu | 357 |
| Persian | 289 |
| Norweigan | 282 |
| Portuguese | 277 |
| Hindi | 214 |
| Tagalog | 205 |
| Swedish | 173 |
| Bulgarian | 165 |
| Estonian | 140 |
Given the nature of world news and that the spotlight has very much on the United States this past week, it is not surprising at all to see that English is by far the dominant language. What is useful about this exercise, however, is to be able to provide a quantitative comparison between the number of tweets authored in English and Arabic. It is also a bit surprising to see that other widely spoken languages such as Spanish appear with such low frequency. A closer investigation of the English tweets might be worthwhile to look for traces of “Spanglish” or other mixed language characteristics.
What?
One of the more useful pieces of metadata that is tucked away in a tweet is a field with the tweet entities such as hashtags, user mentions, and URLs nicely parsed out for easy analysis. In all, there were approximately 44,000 unique hashtags (after normalizing to lowercase) with a combined frequency of 2.7 million mentions that included #Syria (and common variations) itself. There were over 64,000 unique screen names and more than 130,000 unique URLs appearing in the tweets. (It may be possible that there is actually a lesser number of unique URLs since many of the URLs are short links that might resolve to the same address. Additional analysis would be required to make this determination.)
This chart conveys frequencies for the top 100 tweet entities for each category to show the similarity in the characteristics of the distributions.

Frequencies for the top 100 co-occurring hashtags, screen names, and URLs with #Syria
Additionally, the following column-oriented table presents a compact view of the top 50 tweet entities for each category that you can review to confirm and challenge intuition about what you’d suspect to be the most frequently occurring tweet entities. (Note that there is no correlation for the items grouped in each row besides the row number itself, which corresponds to overall rank. The format of this table is purely to provide a compact view of the data.)
| Hashtag | Hashtag Freq | Screen Name | Screen Name Freq | URL | URL Freq |
|---|---|---|---|---|---|
| Syria | 911625 | BarackObama | 21766 | http://bit.ly/16u5nsX | 9742 |
| syria | 114129 | RT_com | 12625 | http://on.rt.com/0yh5ju | 3579 |
| tcot | 42097 | repjustinamash | 11502 | http://twitpic.com/adfcos | 2624 |
| Obama | 41284 | IAmWW3 | 8565 | http://www.avaaz.org/en/solution_for_syria_loc/?twi | 2591 |
| سوريا | 34454 | trutherbot | 8333 | http://buff.ly/18xkbaT | 2138 |
| US | 26108 | SenJohnMcCain | 7629 | http://bit.ly/182SnLh | 1874 |
| Assad | 21734 | YourAnonNews | 6715 | http://equalforce.net | 1335 |
| Iraq | 21518 | Refugees | 6039 | http://bit.ly/17oFmzn | 1190 |
| health | 20975 | StateDept | 5246 | http://is.gd/joaNyV | 1174 |
| egypt | 18916 | FoxNews | 5220 | http://is.gd/SQP0KE | 1138 |
| SYRIA | 18463 | WhiteHouse | 5061 | http://is.gd/UlnFPr | 1137 |
| world | 18457 | SpeakerBoehner | 4496 | http://www.washingtonpost.com/blogs/post-politics-live/the-senates-syria-hearing-live-updates/?id=ed01ca14-222b-4a23-b12c-c0b0d9d4fe0a | 1072 |
| Iran | 18317 | politico | 4237 | http://fxn.ws/15r0K1n | 1033 |
| politics | 18126 | SenRandPaul | 3776 | http://www.hazteoir.org/alerta/53080-se-or-obama-no-otra-matanza-siria | 1027 |
| News | 17432 | AlArabiya_Eng | 3731 | http://is.gd/czuRAd | 989 |
| UN | 16796 | AJELive | 3592 | http://ara.tv/52jq9 | 890 |
| Egypt | 16191 | RevolutionSyria | 3486 | http://unhcr.org/522484fc9.html | 867 |
| Russia | 15847 | truthstreamnews | 3429 | http://is.gd/3196CO | 856 |
| USA | 15772 | JohnKerry | 3275 | http://is.gd/JZZrwU | 803 |
| G20 | 14685 | UN | 3182 | http://dontattacksyria.com | 785 |
| FOX | 13039 | iyad_elbaghdadi | 3143 | http://on.rt.com/04i6h3 | 780 |
| Benghazi | 12779 | CNN | 3138 | http://ow.ly/i/32Sr1 | 779 |
| news | 12507 | Partisangirl | 3127 | http://dld.bz/cNYSs | 747 |
| Euronews | 11941 | YoungCons | 2933 | http://is.gd/RHySNU | 710 |
| Headline | 11833 | AbbyMartin | 2817 | http://is.gd/0pFjAP | 680 |
| Breaking | 11643 | YouTube | 2775 | http://is.gd/TUI0Ql | 666 |
| fail | 11160 | ChristiChat | 2706 | http://is.gd/lKi3WP | 632 |
| LONDON | 10859 | AmbassadorPower | 2647 | http://pccc.me/17coyWv | 604 |
| newsfeed | 10102 | UNICEF | 2618 | https://17q.org/7vw77p | 576 |
| middleeast | 9804 | msnbc | 2469 | http://1.usa.gov/17bAAmd | 574 |
| Congress | 9414 | BBCWorld | 2441 | http://twitter.com/rx | 572 |
| Israel | 9312 | AnonOpsLegion | 2436 | http://is.gd/uMgUJo | 569 |
| ww3 | 9085 | Politics_PR | 2401 | http://on.rt.com/ztbwir | 537 |
| p2 | 9043 | LouisFarrakhan | 2380 | http://scriptonitedaily.wordpress.com/2013/09/03/why-is-the-bbc-banging-the-war-drum-on-syria-just-look-who-runs-it/ | 522 |
| Kerry | 8998 | Reuters | 2364 | http://youtu.be/ODegqpM7usw | 519 |
| CNN | 8628 | guardian | 2301 | http://www.youtube.com/watch?v=dWVdXuTYlH8 | 512 |
| HandsOffSyria | 8606 | BBCBreaking | 2219 | http://uni.cf/17F4UEI | 511 |
| nukes | 8599 | RickWarren | 2165 | http://on.rt.com/3j9p5o | 510 |
| Lebanon | 8537 | charlespgarcia | 2144 | http://www.livetradingnews.com/un-official-syrian-rebels-used-sarin-nerve-gas-assads-army-6636.htm | 488 |
| Act2EndAssadsWar | 8363 | AP | 2127 | http://www.washingtonpost.com/blogs/worldviews/wp/2013/08/29/9-questions-about-syria-you-were-too-embarrassed-to-ask/ | 483 |
| BBC | 8329 | ChakerKhazaal | 2111 | http://is.gd/CnDZsT | 469 |
| Damascus | 8124 | David_Cameron | 2092 | http://is.gd/pysWu3 | 467 |
| war | 8044 | tintin1957 | 2072 | http://www.jpost.com/Experts/When-will-the-Muslim-world-stop-blaming-Jews-for-its-problems-325177 | 465 |
| NoWarWithSyria | 7817 | JohnFugelsang | 1951 | http://aje.me/KL34vQ | 465 |
| AP | 7742 | WebsterGTarpley | 1945 | http://is.gd/mH7tEK | 465 |
| Putin | 7663 | ABC | 1901 | http://j.mp/14VZneq | 462 |
| ABC | 7358 | GOP | 1899 | http://act.boldprogressives.org/survey/syria_survey | 457 |
| TCOT | 7048 | piersmorgan | 1895 | http://is.gd/32VAgs | 454 |
| reuters | 6858 | nycjim | 1863 | http://is.gd/Hu7B4A | 454 |
| Turkey | 6477 | IngrahamAngle | 1827 | http://youtu.be/EV5q1gHJcWA | 451 |
It isn’t surprising to see variations of the hashtag “Syria” (including the Arabic translation سوريا) and screen names corresponding to President Obama along with other well-known politicians such as Speaker John Boehner, Senators John McCain and Rand Paul, and Secretary of State John Kerry at the top of the list. In fact, the appearance of these entities is one of the most compelling things about this analysis: it was generated purely from machine readable data with very little effort and could have been completely automated.
…the appearance of these entities is one of the most compelling things about this analysis: it was generated purely from machine readable data with very little effort and could have been completely automated…
The tweet entities, including URLs is remarkably fascinating and well worth some extra attention. Although we won’t do it here, a worthwhile followup exercise would be to summarize the content from the webpages and mine it separately by applying Example 24 (Summarizing Link Targets) from Chapter 9 (Twitter Cookbook). These web pages are likely to be the best sources for sentiment analysis, which is one of the holy grails of Twitter analytics that can be quite tricky to detect from the 140 characters of the tweets themselves.
Where?
Of the 1.1 million tweets collected, only approximately 0.5% (~6,000) of them contained geo-coordinates that could be converted to GeoJSON and plotted on a map. The image below links to an interactive map that you can navigate and zoom in on the clusters and view tweet tweet content by geography. You can read more about how the interactive visualization was constructed in a previous post entitled What Are People Tweeting About Syria in Your Neck of the Woods?

Approximately 0.5% (~6,000) of the 1.1 million tweets that included geo-coordinates are available to explore as an interactive map visualization
Although only 0.5% of all tweets containing geo-coordinates may sound a bit low, bear in mind the previous finding that certain “retweet bot” and news accounts are generating massive amounts of content and will probably not include geo-coordinates. (Somewhere on the order of 1% of tweets containing geo-coordinates is also consistent with other analysis I’ve done on Twitter data.)
What is a bit surprising about the geo-coordinates (but then starts to make some amount of sense) once you take a closer look is that there is a small number of geo-enabled accounts that generate a disproportionate amount of content just as there were with the larger aggregate as we earlier observed.
Try zooming in on the area around Berkeley, California, for example, and you’ll notice that there is one particular account, @epaulnet, that is mobile and generated virtually all of the content for the cluster in that region as shown below.

Some accounts generating disproportionate amounts of content appears to hold true for tweets that include geo-coordinates. Virtually all of these coordinates around Berkeley, CA are generated by the same account.
A chart displaying the proportionality of each geo-enabled account relative to the frequency of tweets that it produces is shown below and consistent with previous findings. It is a bit surprising that the amount of content generated by accounts with geo-coordinates enabled is highly skewed. However, it starts to make some sense once you consider that it conforms to the larger aggregate population.
Select users generate highly disproportionate amounts of tweets with geocoordinates. The user @epaulnet as shown in the screenshot of Berkeley, CA above is at the head of this particular curve and generated over 800 tweets in less than one week!
Although omitted for brevity, it is worth noting that the timestamps in which the geo-enabled content was produced also correlated to the larger population in which all other content was produced.
When?
As a final consideration, let’s briefly explore the time of day in which tweets are being authored. The following chart displays the number of tweets authored by hour and is standardized to UTC (London) time. In mentally adjusting the time, recall that London is 5 hours ahead of the East Coast (EST) and 8 hours ahead of the West Coast (PST).
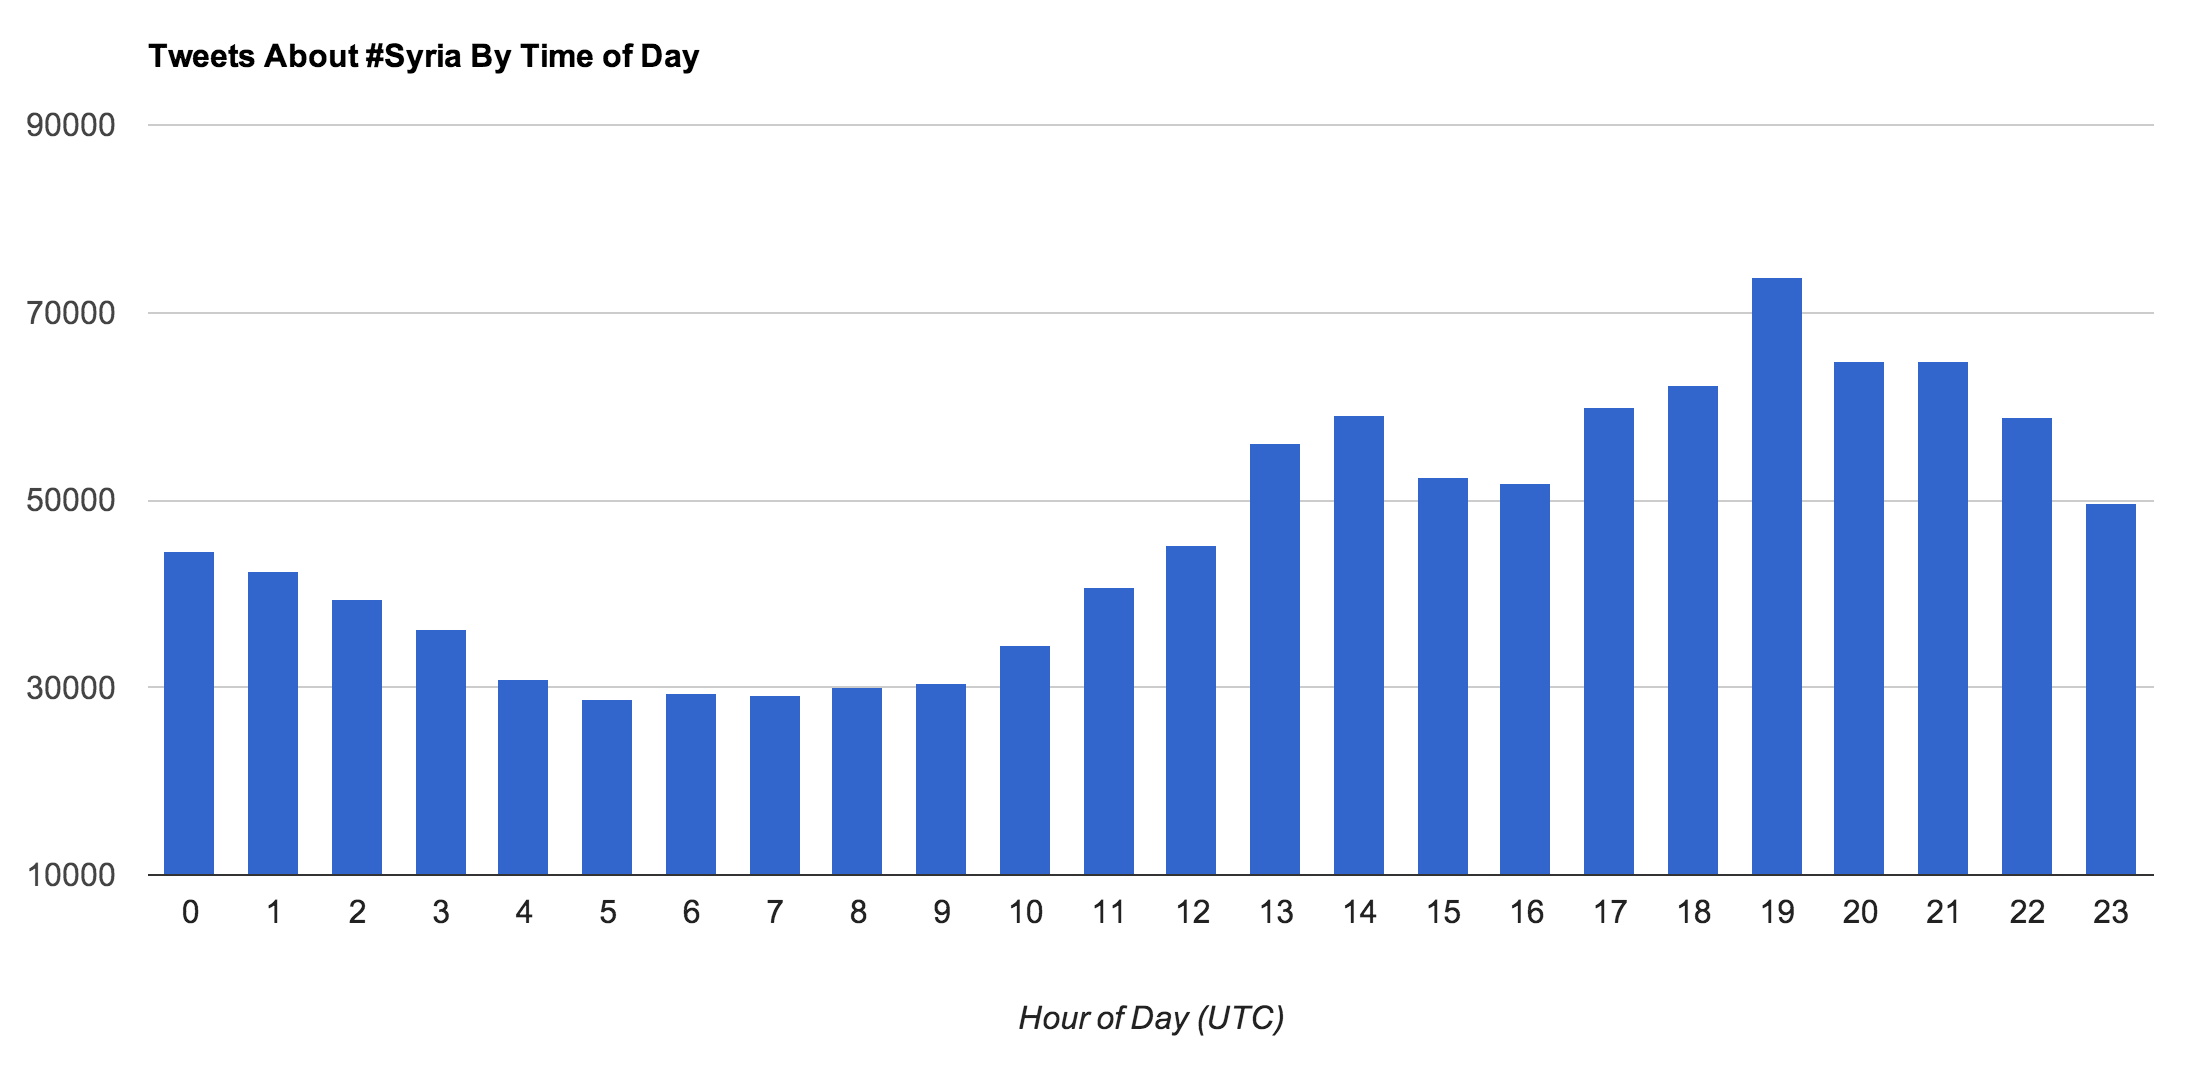
Tweets bucketed by hour of day and standardized to UTC (London) time.
For convenience, the same chart is duplicated below but framed in terms of U.S. East Coast time so that you it’s easier to think about it in terms of a continuous 24 hour period without having to “wraparound.”

Tweets bucketed by hour of day and standardized to EST (U.S. East Coast) time.
There is clearly an ebb and flow of when tweets are authored with a spread that is well beyond twice the minimum value in the chart. It would appear that most of the tweeting is happening during and after the evening news in London and western Europe, which roughly corresponds to lunchtime across the United States. However, it does seem a bit surprising that there isn’t a similar spike in tweeting after the evening news in the United States.
Closing Thoughts
With just a little bit of pre-planning, you can filter Twitter’s firehose for content pertaining to any topic that interests you and conduct a preliminary analysis just like this one and much more. A key part of making the whole process as easy as it should be is being equipped with the technical know-how and a toolbox that contains the right combination of templates. The GitHub repository for Mining the Social Web, 2nd Edition is jam-packed with useful starting points for mining Twitter as well as Facebook, LinkedIn, Github, and more.
Although, this post was just an exploratory effort that initially sized up a non-trivial data set involving more than one million tweets, we also learned a few things along the way and discovered a few anomalies that are worth further investigation. If nothing else, you hopefully enjoyed this content and now have some ideas as to how you could run your own data science experiment.
===
If you enjoyed this post that featured a sliver of what you can begin to do with Twitter data, you may also enjoy the broader story of social web mining as chronicled in a 400+ page book that’s designed to be the “premium support” for the open source project that’s on GitHub. You can purchase the DRM-free ebook directly from O’Reilly and receive free updates for life.
Read more about the journey of authoring Mining the Social Web, 2nd Edition and how I tried to apply lean practices to make it the best possible resource for mainstream data mining in Reflections on Authoring a Minimum Viable Book.

How did you turn the data from mongodb into those great-looking charts?
All of the charts with the exception of one were generated from a Google Spreadsheet.
Pingback: What Are People Tweeting About #Syria in Your Neck of the Woods? | Mining the Social Web
Pingback: Mining One Million Tweets About #Syria - Programming - O'Reilly Media
Thanks for introducing this material here. I also thank you for your excellent book.
My question is that the data collected from the codes above is in json format. When I view the data in Excel (after exporting the data from Mongodb using mongoexport to a csv file), the records are not properly aligned. For example, the texts of most tweets appear in Column E, but there are also exceptions: the texts of some tweets are not in a single column but across two columns. This causes misalignment of the data.
Another issue is that the number of columns for each record (or tweet) are different. Some tweets have a larger number of columns than others.
How to resolve these two issues prior to analysis?
Thanks again.
Hi Amy – I haven’t tried to export these results as CSV from mongoexport in the way that you described, but I’m not totally surprised to hear that there are some alignment issues in its automatic export of fairly complex JSON to CSV.
My best recommendations would be to 1) run a couple of queries to drill down to a narrower subset of fields and try mongoexport with that narrower (flatter) portion of the data, and/or 2) write a few lines of code to export the fields that you are interested in to a CSV format manually.
I’m happy to try and help you work through some more of the details if you can explain a bit more about exactly what your objectives are in mining the data. Just let me know what I can do to help.
Thanks for your response. I am playing with your book. There are some issues I can’t resolve myself.
An example: I tried Chapter1 Example 6 (extracting texts, screen names, hashtags). The codes works with your provided json file (MentionSomeoneImportantForYou.json). But, when I load my own json file, I receive error messages.
Traceback (most recent call last):
File “C:/CH1-Example6- Extracting text, screen names, and hashtags from tweets.py”, line 25, in
statuses = json.loads(open(‘c:/bigdata.json’).read())
File “C:\Python27\lib\json\__init__.py”, line 326, in loads
return _default_decoder.decode(s)
File “C:\Python27\lib\json\decoder.py”, line 369, in decode
raise ValueError(errmsg(“Extra data”, s, end, len(s)))
ValueError: Extra data: line 2 column 1 – line 40 column 1 (char 7156 – 168126)
Thanks.
EDIT: After I looked at this online (as opposed to email) I saw your previous comment and now think that my guess below about this being a MongoDB export as JSON is probably correct now that it’s all in context for me.
Try this following snippet to load it as valid JSON –
# Convert the line delimited file of JSON objects into a valid JSON array
json_string = “[{0}]”.format(“,”.join([l for l in open(“your_file.json”).readlines()]))
# And now load it up as Python data for analysis
python_data = json.loads(json_string)
==
Hi Amy – Can you elaborate on what you mean when you say “my own JSON file”? Is this an export from MongoDB or did you acquire this data some other way?
If I had to guess, your error message leads me to guess that you’ve exported your data from Mongo as “one JSON record per line” and then you’re trying to load that as JSON. If that’s the case, then I can share you a snippet that will transform that data export into *valid* JSON so that you can load it. Let me know…
BTW, this might be a little easier to troubleshoot at GitHub if you want to open an issue and track it there – https://github.com/ptwobrussell/Mining-the-Social-Web-2nd-Edition/issues?state=open
Amy – just updated my previous response with an update that I think will sort this out for you.
BTW, I have a new post (and webinar) coming out next week where I teach you how to load up non-trivial volumes of data from the firehose with pandas and do some analysis. The pandas library is a great power tool for analyzing Twitter data, so this might be of interest to you.
Pingback: Computing Twitter Influence, Part 2 - Programming - O'Reilly Media
Matthew-Thanks for your suggestion. I tried it, but received a different error message (SyntaxError: Non-ASCII character ‘\xe2′ in file … , but no decoding declared …).
Then, I found a code from the web, which did a trick! Looking like…
for line in open(‘myfile.json’):
try:
twitter.append(json.loads(line))
Do you know why this works for a json file I acquired using Ch9 Ex7, not the code in Ch1 Ex6?
Thanks for your contribution always!
Hey Amy,
The error you are receiving is a “dreaded Unicode error.” One of the few things that Python 2.x didn’t get right was Unicode. Without a long digression, it was fixed in Python 3, but in Python 2.x, there is a base string class that str and unicode both descend from and it causes all sorts of havoc.
In the text (and notebooks themselves), I’ve tried to be as pedantic as possible about this, and in a lot of cases when dealing with “arbitrary text”, good libs like BeautifulSoup will help take most of the pain away, but in this case, you undoubtedly had some (non-ASCII) UTF-8 in your file, and the code snippet that I originally provided was treating it as ASCII.
Probably the code I should have suggested to be pedantic with UTF-8 handling was something like this:
===
import codecs
# Convert the line delimited file of JSON objects into a valid JSON array
json_string = u“[{0}]“.format(u“,”.join([l for l in codecs.open(“your_file.json”, “r”, “utf-8”).readlines()]))
# And now load it up as Python data for analysis
python_data = json.loads(json_string)
===
I haven’t tested that snippet specifically, but from memory, I think that’s what you’d want to do to ensure that all file input is handled properly.
This gist (from a long time ago) may also be instructive –
This file contains hidden or bidirectional Unicode text that may be interpreted or compiled differently than what appears below. To review, open the file in an editor that reveals hidden Unicode characters.
Learn more about bidirectional Unicode characters
gistfile1.py
hosted with ❤ by GitHub
This is also a classic post that you should check out –
http://www.joelonsoftware.com/articles/Unicode.html