
Surprising Stats From Mining One Million Tweets About #Syria
Posted on September 9, 2013 12 Comments

I’ve been filtering Twitter’s firehose for tweets about “#Syria” for about the past week in order to accumulate a sizable volume of data about an important current event. As of Friday, I noticed that the tally has surpassed one million tweets, so it seemed to be a good time to apply some techniques from Mining the Social Web and explore the data.
While some of the findings from a preliminary analysis confirm common intuition, others are a bit surprising. The remainder of this post explores the tweets with a cursory analysis addressing the “Who?, What?, Where?, and When?” of what’s in the data.
If you haven’t been keeping up with the news about what’s happening in Syria, you might benefit from a piece by the Washington Post entitled 9 questions about Syria you were too embarrassed to ask as helpful background knowledge.
Filtering the Firehose
In addition to an introduction for mining Twitter data that’s presented in Chapter 1 (Mining Twitter) of Mining the Social Web, 2nd Edition, a cookbook of more than two dozen recipes for mining Twitter data is featured in Chapter 9 (Twitter Cookbook.) The recipes are fairly atomic and designed to be composed as simple building blocks that can be copied, pasted, minimally massaged in order to get you on your way. (In a nutshell, that’s actually the purpose of the entire book for the broader social web: to give you the tools that you need to transform curiosity into insight as quickly and easily as possible.)
You can adapt concepts from three primary recipes to filter and archive tweets from Twitter’s firehose:
- Accessing Twitter’s API for Development Purposes (Example 9-1)
- Saving and Accessing JSON Data with MongoDB (Example 9-7)
- Sampling the Twitter Firehose with the Streaming API (Example 9-8)
Although there is a little bit of extra robustness you may want to add to the code for certain exceptional circumstances, the essence of the combined recipes is quite simple as expressed in the following Python code example:
import twitter
import pymongo

# Our query of interest
q = '#Syria'

# See Example 9-1 (Accessing Twitter's API...) for API access
twitter_stream = twitter.TwitterStream(auth=twitter.oauth.OAuth(...))

# See https://dev.twitter.com/docs/streaming-apis for more options
# in filtering the firehose
stream = twitter_stream.statuses.filter(track=q)

# Connect to the database
client = pymongo.MongoClient()
db = client["StreamingTweets"]

# Read tweets from the stream and store them to the database
for tweet in stream:
    db["Syria"].insert(tweet)
In other words, you just request authorization, filter the public stream for a search term, and stash away the results to a convenient medium like MongoDB. It really is that easy! In just over a week, I’ve collected in excess one million tweets (and counting) using exactly this approach, and you could do the very same thing for any particular topic that interests you. See the IPython Notebook featuring the Twitter Cookbook for all of the finer details.)
As discussed at length in Chapter 1 of Mining the Social Web, there is roughly 5KB of metadata that accompanies those 140 characters that you commonly think of as a tweet! A few of the metadata fields that we’ll leverage as part of exploring the data in this post include:
- Who: The author’s screen name and language
- What: Tweet entities such as #hashtags, @mentions, and URLs
- Where: Geo-Coordinates for where the tweet was authored
- When: The date and time the tweet was authored
Of course, there are some other details tucked away in the 5KB of metadata that could also be useful, but we’ll limit ourselves to just using these fields for this post. The goal is just to do some initial exploration and compute some basic statistics as opposed to compute anything scholarly or definitive.
…there is roughly 5KB of metadata that accompanies those 140 characters that you commonly think of as a tweet…
The remainder of this section presents some of the initial findings from mining the data with Python and techniques from the social web mining toolbox.
Who?
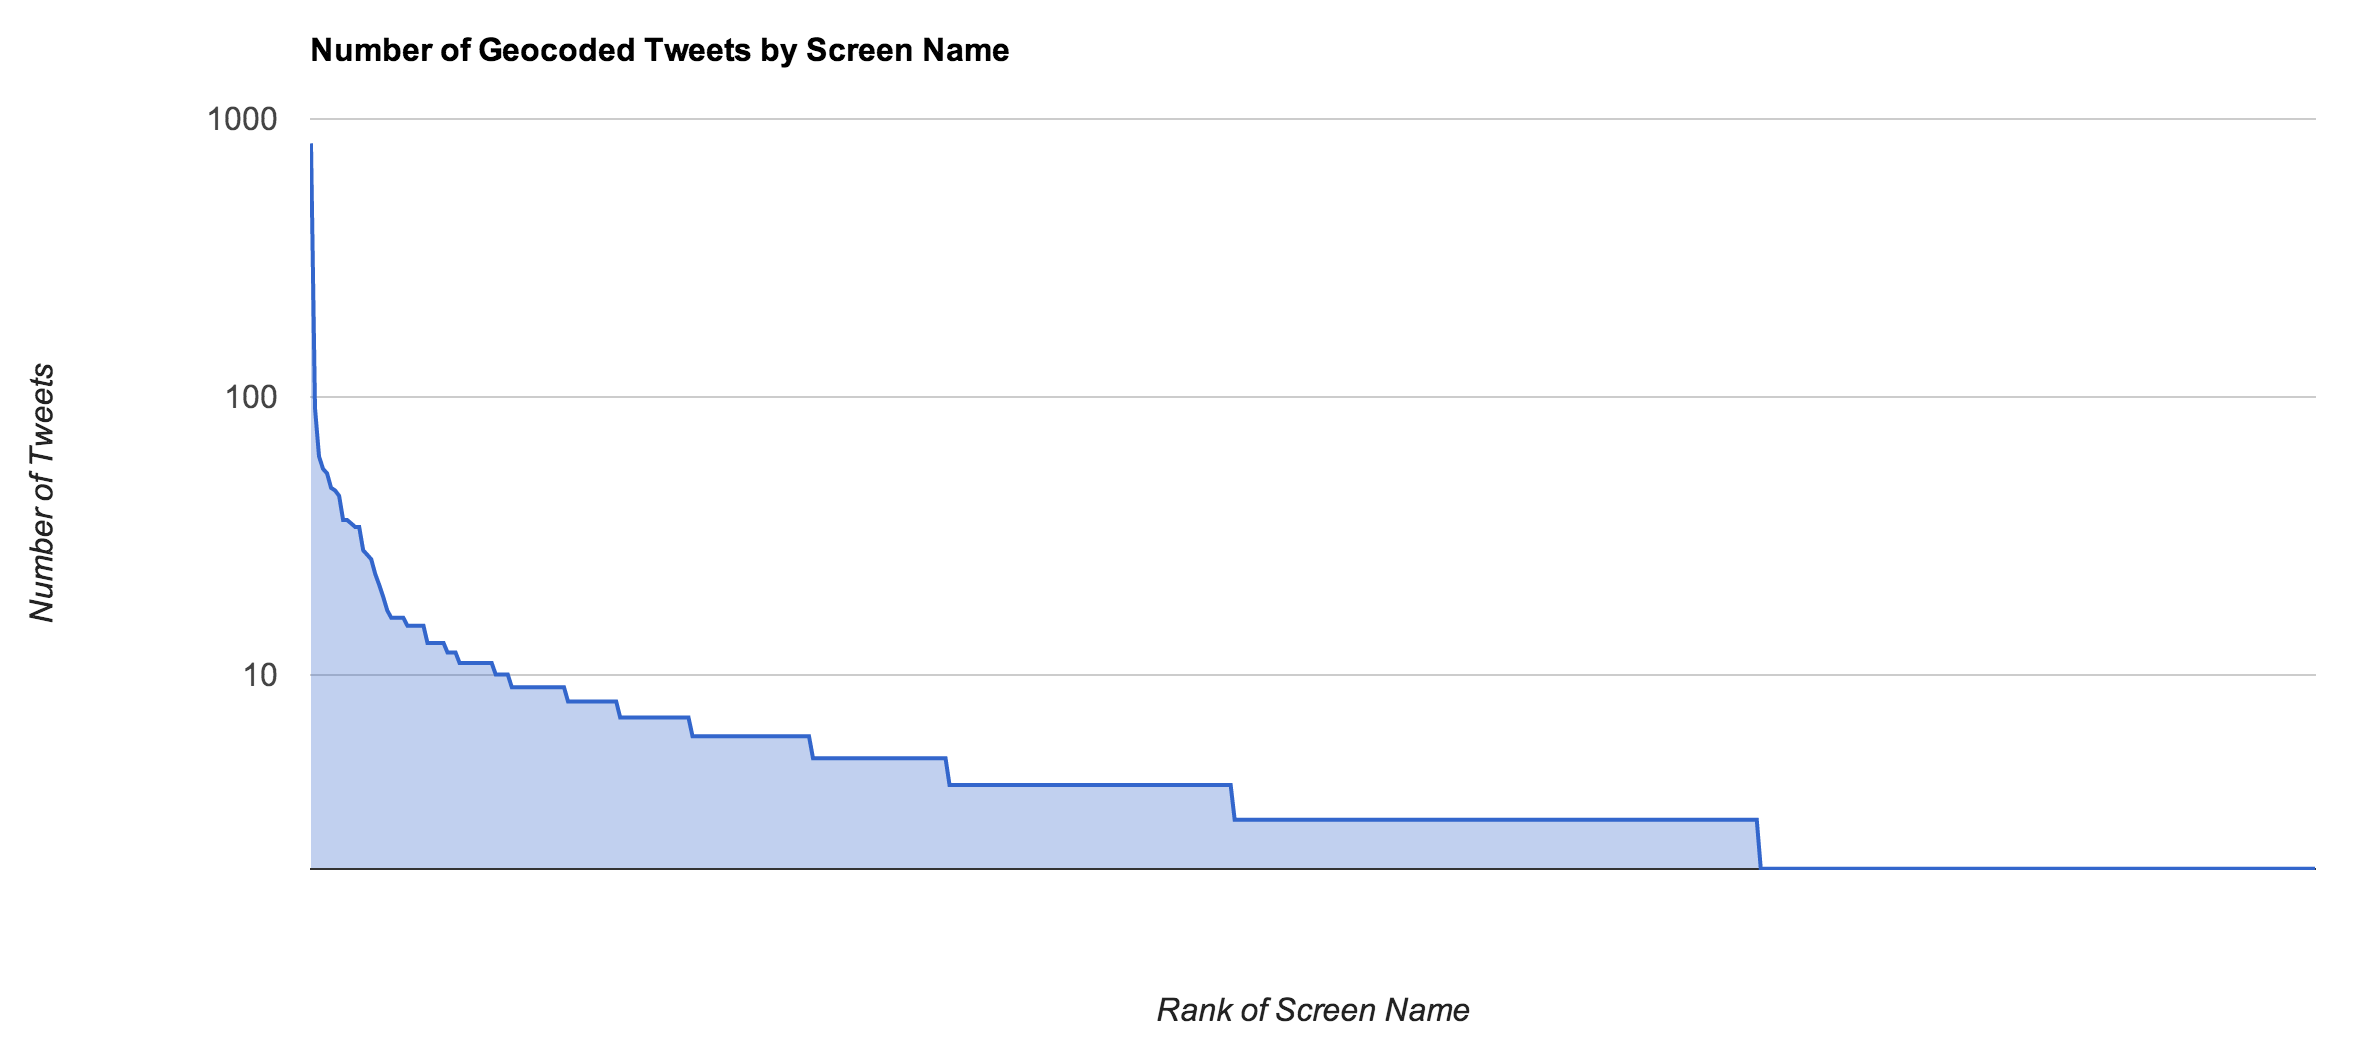
The underlying frequency distribution for the authors of the tweets reveals that there just over 305,000 accounts that have contributed the 1.1 million tweets in the data set. The underlying frequency distribution shown below reveals a long tail with certain accounts at the head of the curve contributing highly disproportionate numbers to the overall aggregate.

The frequency distribution for authors contributing tweets about #Syria reveals a long tail with certain accounts contributing highly disproportionate numbers of tweets. The x-axis is the rank of each screen name in descending order of frequency, and the y-axis is the number of tweets authored by that screen name.
A closer inspection of the accounts contributing disproportionate numbers of tweets reveals that the top accounts (such as RT3Syria as shown below) appear to be bots that are retweeting anything and everything about Syria. This finding makes sense given that it is unlikely that any human being could author hundreds of meaningful tweets a day.
On the chart, notice that at around the 100,000th rank, the number of tweets per author reaches one, which means that 200,000 of the 1.1 million tweets are accounted for by 200,000 unique accounts while the other 900,000 tweets are shared amongst the remaining 100,000 accounts. In aggregate, this means that about 80% of the content is accounted for by one-third of the contributing accounts!
A table below displays the frequency information for any screen name contributing more than 1,000 tweets in case you’d like to further investigate these accounts that sit at the head of the curve.
| Screen Name | Frequency |
|---|---|
| RT3Syria | 4068 |
| SyriaTweetEn | 3546 |
| irane_Azad | 3146 |
| Neda30 | 2339 |
| AzadiIran92 | 2164 |
| FreeIran9292 | 2123 |
| IraneAzad_92 | 2062 |
| Logunov_Daniil | 2053 |
| Abdirizak2327 | 1940 |
| tintin1957 | 1801 |
| SyrianRevo | 1657 |
| kokoyxx_xxx2903 | 1646 |
| RT3Iraq | 1644 |
| 4VictoryInIran | 1592 |
| shiiraaryare | 1572 |
| ILA_2013 | 1537 |
| FreeMyIran | 1487 |
| dictatorpost | 1434 |
| AajelSyria | 1422 |
| Mojahedineng | 1354 |
| NewIranFree | 1314 |
| TheVoiceArtist | 1303 |
| EqlF07 | 1302 |
| 17febpage | 1288 |
| YallaSouriya | 1256 |
| mog7546 | 1246 |
| KalamoonNews | 1239 |
| Iran1392Azad | 1225 |
| USRadioNews | 1191 |
| Opshy | 1181 |
| RobotsforObama | 1175 |
| Victory92Iran1 | 1143 |
| ErwinFilbert | 1103 |
| FamousDraft | 1086 |
| SyriaTwitte | 1079 |
| Iran1392Victory | 1067 |
| AnonAlgeria | 1064 |
| monitor_view | 1015 |
| HistoryWhite | 1012 |
| watchman_A9 | 1009 |
Another interesting aspect of exploring who is contributing to #Syria tweets is to examine the language of the person who is tweeting. The following chart show that the vast majority of the tweets are written in English and Arabic. However, an separate breakdown excluding English and Arabic is also provided to gist the representation from other languages.

The vast majority of tweets about #Syria are written in English with Arabic coming in second place with around 8.5%.

A breakdown of the ~33,000 tweets that were not written in English or Arabic.
For curiosity’s sake, the following table conveys frequency information for any language that appeared more than 100 times across the 1.1 million tweets.
| Language | Frequency |
|---|---|
| English | 985437 |
| Arabic | 94777 |
| Spanish | 6733 |
| German | 5247 |
| Indonesian | 4500 |
| French | 3342 |
| Turkish | 2400 |
| Slovak | 2313 |
| Italian | 2228 |
| Japanese | 1036 |
| Vietnamese | 967 |
| Russian | 869 |
| Polish | 801 |
| Dutch | 643 |
| Greek | 469 |
| Slovenian | 421 |
| Danish | 419 |
| Urdu | 357 |
| Persian | 289 |
| Norweigan | 282 |
| Portuguese | 277 |
| Hindi | 214 |
| Tagalog | 205 |
| Swedish | 173 |
| Bulgarian | 165 |
| Estonian | 140 |
Given the nature of world news and that the spotlight has very much on the United States this past week, it is not surprising at all to see that English is by far the dominant language. What is useful about this exercise, however, is to be able to provide a quantitative comparison between the number of tweets authored in English and Arabic. It is also a bit surprising to see that other widely spoken languages such as Spanish appear with such low frequency. A closer investigation of the English tweets might be worthwhile to look for traces of “Spanglish” or other mixed language characteristics.
What?
One of the more useful pieces of metadata that is tucked away in a tweet is a field with the tweet entities such as hashtags, user mentions, and URLs nicely parsed out for easy analysis. In all, there were approximately 44,000 unique hashtags (after normalizing to lowercase) with a combined frequency of 2.7 million mentions that included #Syria (and common variations) itself. There were over 64,000 unique screen names and more than 130,000 unique URLs appearing in the tweets. (It may be possible that there is actually a lesser number of unique URLs since many of the URLs are short links that might resolve to the same address. Additional analysis would be required to make this determination.)
This chart conveys frequencies for the top 100 tweet entities for each category to show the similarity in the characteristics of the distributions.

Frequencies for the top 100 co-occurring hashtags, screen names, and URLs with #Syria
Additionally, the following column-oriented table presents a compact view of the top 50 tweet entities for each category that you can review to confirm and challenge intuition about what you’d suspect to be the most frequently occurring tweet entities. (Note that there is no correlation for the items grouped in each row besides the row number itself, which corresponds to overall rank. The format of this table is purely to provide a compact view of the data.)
| Hashtag | Hashtag Freq | Screen Name | Screen Name Freq | URL | URL Freq |
|---|---|---|---|---|---|
| Syria | 911625 | BarackObama | 21766 | http://bit.ly/16u5nsX | 9742 |
| syria | 114129 | RT_com | 12625 | http://on.rt.com/0yh5ju | 3579 |
| tcot | 42097 | repjustinamash | 11502 | http://twitpic.com/adfcos | 2624 |
| Obama | 41284 | IAmWW3 | 8565 | http://www.avaaz.org/en/solution_for_syria_loc/?twi | 2591 |
| سوريا | 34454 | trutherbot | 8333 | http://buff.ly/18xkbaT | 2138 |
| US | 26108 | SenJohnMcCain | 7629 | http://bit.ly/182SnLh | 1874 |
| Assad | 21734 | YourAnonNews | 6715 | http://equalforce.net | 1335 |
| Iraq | 21518 | Refugees | 6039 | http://bit.ly/17oFmzn | 1190 |
| health | 20975 | StateDept | 5246 | http://is.gd/joaNyV | 1174 |
| egypt | 18916 | FoxNews | 5220 | http://is.gd/SQP0KE | 1138 |
| SYRIA | 18463 | WhiteHouse | 5061 | http://is.gd/UlnFPr | 1137 |
| world | 18457 | SpeakerBoehner | 4496 | http://www.washingtonpost.com/blogs/post-politics-live/the-senates-syria-hearing-live-updates/?id=ed01ca14-222b-4a23-b12c-c0b0d9d4fe0a | 1072 |
| Iran | 18317 | politico | 4237 | http://fxn.ws/15r0K1n | 1033 |
| politics | 18126 | SenRandPaul | 3776 | http://www.hazteoir.org/alerta/53080-se-or-obama-no-otra-matanza-siria | 1027 |
| News | 17432 | AlArabiya_Eng | 3731 | http://is.gd/czuRAd | 989 |
| UN | 16796 | AJELive | 3592 | http://ara.tv/52jq9 | 890 |
| Egypt | 16191 | RevolutionSyria | 3486 | http://unhcr.org/522484fc9.html | 867 |
| Russia | 15847 | truthstreamnews | 3429 | http://is.gd/3196CO | 856 |
| USA | 15772 | JohnKerry | 3275 | http://is.gd/JZZrwU | 803 |
| G20 | 14685 | UN | 3182 | http://dontattacksyria.com | 785 |
| FOX | 13039 | iyad_elbaghdadi | 3143 | http://on.rt.com/04i6h3 | 780 |
| Benghazi | 12779 | CNN | 3138 | http://ow.ly/i/32Sr1 | 779 |
| news | 12507 | Partisangirl | 3127 | http://dld.bz/cNYSs | 747 |
| Euronews | 11941 | YoungCons | 2933 | http://is.gd/RHySNU | 710 |
| Headline | 11833 | AbbyMartin | 2817 | http://is.gd/0pFjAP | 680 |
| Breaking | 11643 | YouTube | 2775 | http://is.gd/TUI0Ql | 666 |
| fail | 11160 | ChristiChat | 2706 | http://is.gd/lKi3WP | 632 |
| LONDON | 10859 | AmbassadorPower | 2647 | http://pccc.me/17coyWv | 604 |
| newsfeed | 10102 | UNICEF | 2618 | https://17q.org/7vw77p | 576 |
| middleeast | 9804 | msnbc | 2469 | http://1.usa.gov/17bAAmd | 574 |
| Congress | 9414 | BBCWorld | 2441 | http://twitter.com/rx | 572 |
| Israel | 9312 | AnonOpsLegion | 2436 | http://is.gd/uMgUJo | 569 |
| ww3 | 9085 | Politics_PR | 2401 | http://on.rt.com/ztbwir | 537 |
| p2 | 9043 | LouisFarrakhan | 2380 | http://scriptonitedaily.wordpress.com/2013/09/03/why-is-the-bbc-banging-the-war-drum-on-syria-just-look-who-runs-it/ | 522 |
| Kerry | 8998 | Reuters | 2364 | http://youtu.be/ODegqpM7usw | 519 |
| CNN | 8628 | guardian | 2301 | http://www.youtube.com/watch?v=dWVdXuTYlH8 | 512 |
| HandsOffSyria | 8606 | BBCBreaking | 2219 | http://uni.cf/17F4UEI | 511 |
| nukes | 8599 | RickWarren | 2165 | http://on.rt.com/3j9p5o | 510 |
| Lebanon | 8537 | charlespgarcia | 2144 | http://www.livetradingnews.com/un-official-syrian-rebels-used-sarin-nerve-gas-assads-army-6636.htm | 488 |
| Act2EndAssadsWar | 8363 | AP | 2127 | http://www.washingtonpost.com/blogs/worldviews/wp/2013/08/29/9-questions-about-syria-you-were-too-embarrassed-to-ask/ | 483 |
| BBC | 8329 | ChakerKhazaal | 2111 | http://is.gd/CnDZsT | 469 |
| Damascus | 8124 | David_Cameron | 2092 | http://is.gd/pysWu3 | 467 |
| war | 8044 | tintin1957 | 2072 | http://www.jpost.com/Experts/When-will-the-Muslim-world-stop-blaming-Jews-for-its-problems-325177 | 465 |
| NoWarWithSyria | 7817 | JohnFugelsang | 1951 | http://aje.me/KL34vQ | 465 |
| AP | 7742 | WebsterGTarpley | 1945 | http://is.gd/mH7tEK | 465 |
| Putin | 7663 | ABC | 1901 | http://j.mp/14VZneq | 462 |
| ABC | 7358 | GOP | 1899 | http://act.boldprogressives.org/survey/syria_survey | 457 |
| TCOT | 7048 | piersmorgan | 1895 | http://is.gd/32VAgs | 454 |
| reuters | 6858 | nycjim | 1863 | http://is.gd/Hu7B4A | 454 |
| Turkey | 6477 | IngrahamAngle | 1827 | http://youtu.be/EV5q1gHJcWA | 451 |
It isn’t surprising to see variations of the hashtag “Syria” (including the Arabic translation سوريا) and screen names corresponding to President Obama along with other well-known politicians such as Speaker John Boehner, Senators John McCain and Rand Paul, and Secretary of State John Kerry at the top of the list. In fact, the appearance of these entities is one of the most compelling things about this analysis: it was generated purely from machine readable data with very little effort and could have been completely automated.
…the appearance of these entities is one of the most compelling things about this analysis: it was generated purely from machine readable data with very little effort and could have been completely automated…
The tweet entities, including URLs is remarkably fascinating and well worth some extra attention. Although we won’t do it here, a worthwhile followup exercise would be to summarize the content from the webpages and mine it separately by applying Example 24 (Summarizing Link Targets) from Chapter 9 (Twitter Cookbook). These web pages are likely to be the best sources for sentiment analysis, which is one of the holy grails of Twitter analytics that can be quite tricky to detect from the 140 characters of the tweets themselves.
Where?
Of the 1.1 million tweets collected, only approximately 0.5% (~6,000) of them contained geo-coordinates that could be converted to GeoJSON and plotted on a map. The image below links to an interactive map that you can navigate and zoom in on the clusters and view tweet tweet content by geography. You can read more about how the interactive visualization was constructed in a previous post entitled What Are People Tweeting About Syria in Your Neck of the Woods?

Approximately 0.5% (~6,000) of the 1.1 million tweets that included geo-coordinates are available to explore as an interactive map visualization
Although only 0.5% of all tweets containing geo-coordinates may sound a bit low, bear in mind the previous finding that certain “retweet bot” and news accounts are generating massive amounts of content and will probably not include geo-coordinates. (Somewhere on the order of 1% of tweets containing geo-coordinates is also consistent with other analysis I’ve done on Twitter data.)
What is a bit surprising about the geo-coordinates (but then starts to make some amount of sense) once you take a closer look is that there is a small number of geo-enabled accounts that generate a disproportionate amount of content just as there were with the larger aggregate as we earlier observed.
Try zooming in on the area around Berkeley, California, for example, and you’ll notice that there is one particular account, @epaulnet, that is mobile and generated virtually all of the content for the cluster in that region as shown below.

Some accounts generating disproportionate amounts of content appears to hold true for tweets that include geo-coordinates. Virtually all of these coordinates around Berkeley, CA are generated by the same account.
A chart displaying the proportionality of each geo-enabled account relative to the frequency of tweets that it produces is shown below and consistent with previous findings. It is a bit surprising that the amount of content generated by accounts with geo-coordinates enabled is highly skewed. However, it starts to make some sense once you consider that it conforms to the larger aggregate population.
Select users generate highly disproportionate amounts of tweets with geocoordinates. The user @epaulnet as shown in the screenshot of Berkeley, CA above is at the head of this particular curve and generated over 800 tweets in less than one week!
Although omitted for brevity, it is worth noting that the timestamps in which the geo-enabled content was produced also correlated to the larger population in which all other content was produced.
When?
As a final consideration, let’s briefly explore the time of day in which tweets are being authored. The following chart displays the number of tweets authored by hour and is standardized to UTC (London) time. In mentally adjusting the time, recall that London is 5 hours ahead of the East Coast (EST) and 8 hours ahead of the West Coast (PST).
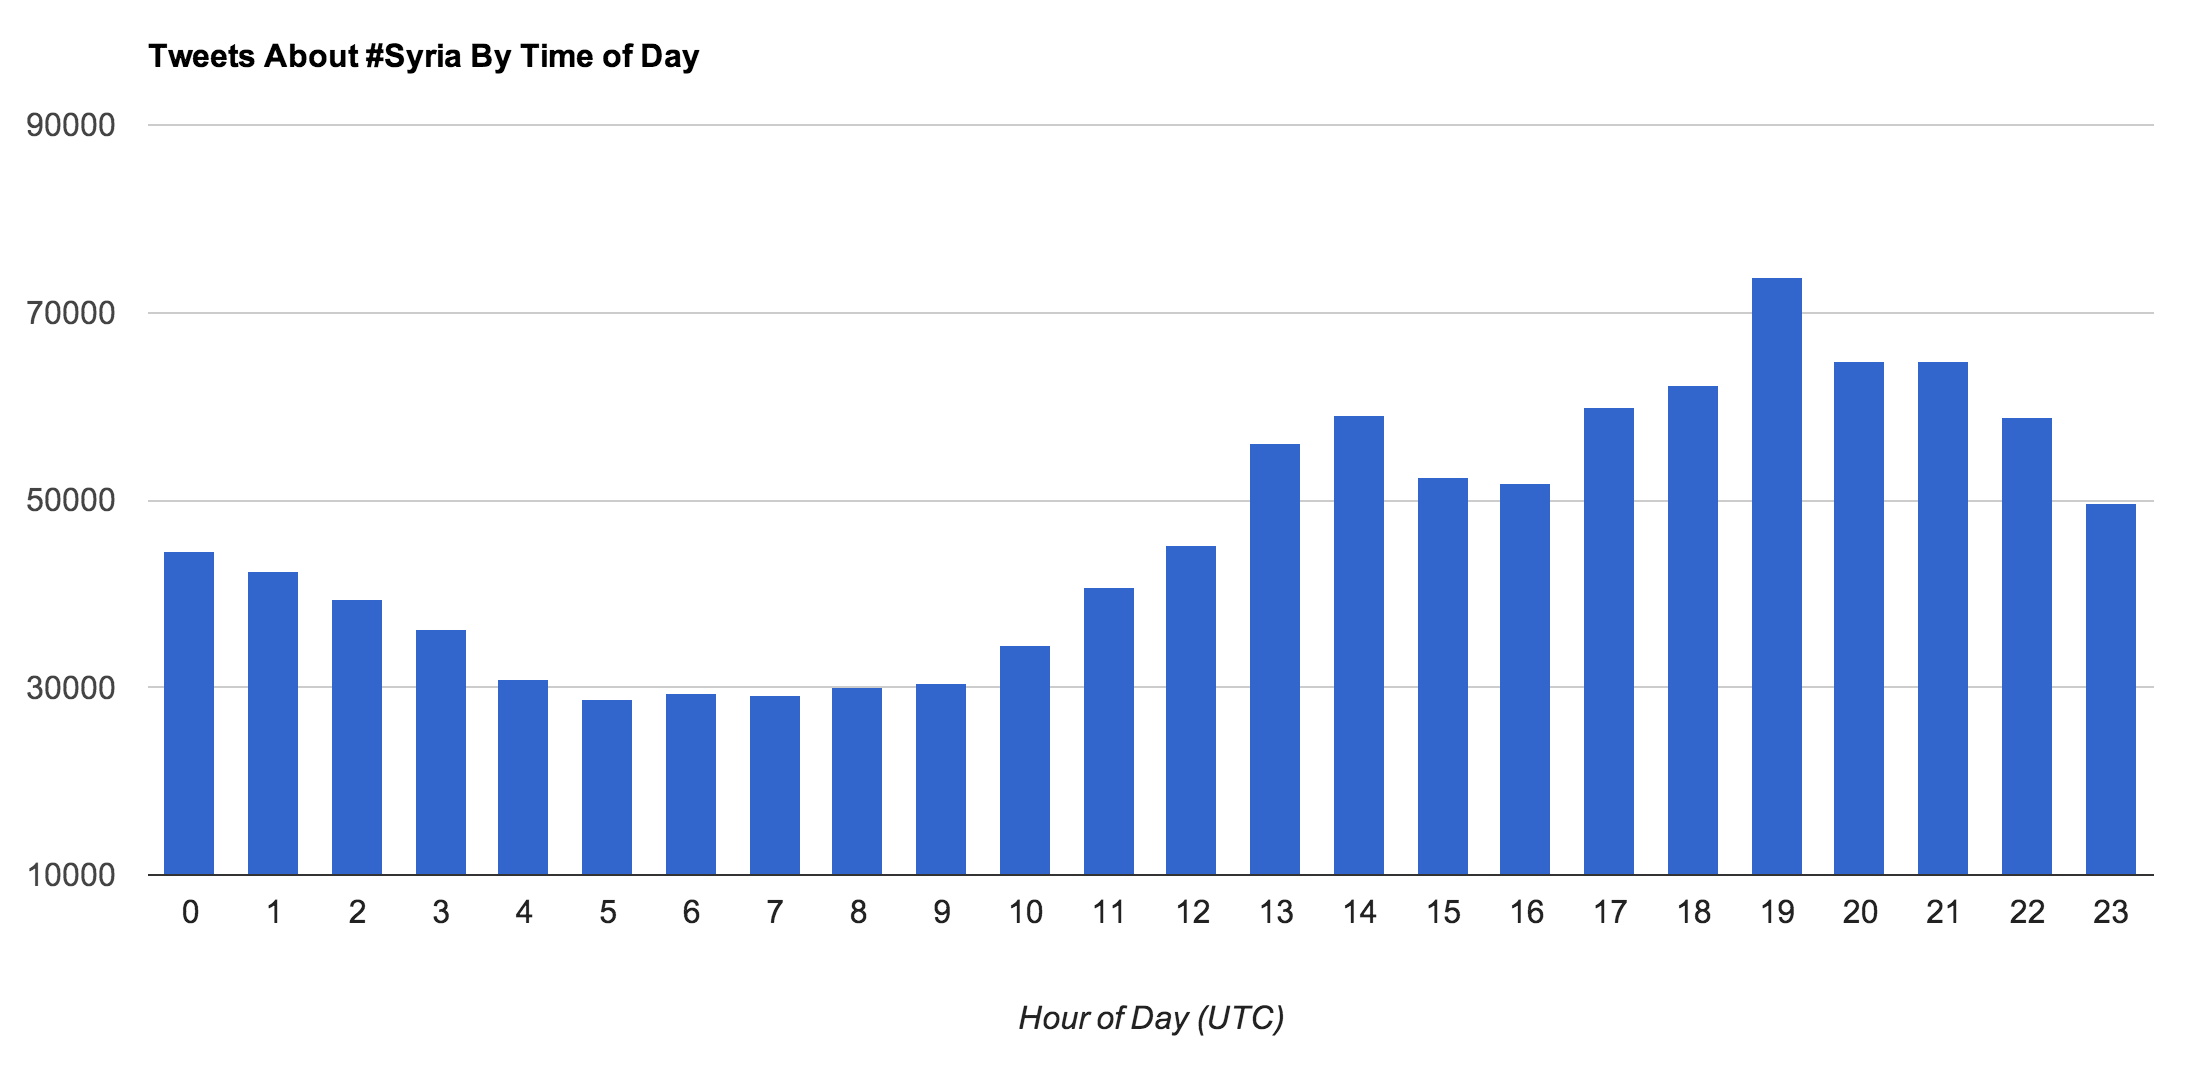
Tweets bucketed by hour of day and standardized to UTC (London) time.
For convenience, the same chart is duplicated below but framed in terms of U.S. East Coast time so that you it’s easier to think about it in terms of a continuous 24 hour period without having to “wraparound.”

Tweets bucketed by hour of day and standardized to EST (U.S. East Coast) time.
There is clearly an ebb and flow of when tweets are authored with a spread that is well beyond twice the minimum value in the chart. It would appear that most of the tweeting is happening during and after the evening news in London and western Europe, which roughly corresponds to lunchtime across the United States. However, it does seem a bit surprising that there isn’t a similar spike in tweeting after the evening news in the United States.
Closing Thoughts
With just a little bit of pre-planning, you can filter Twitter’s firehose for content pertaining to any topic that interests you and conduct a preliminary analysis just like this one and much more. A key part of making the whole process as easy as it should be is being equipped with the technical know-how and a toolbox that contains the right combination of templates. The GitHub repository for Mining the Social Web, 2nd Edition is jam-packed with useful starting points for mining Twitter as well as Facebook, LinkedIn, Github, and more.
Although, this post was just an exploratory effort that initially sized up a non-trivial data set involving more than one million tweets, we also learned a few things along the way and discovered a few anomalies that are worth further investigation. If nothing else, you hopefully enjoyed this content and now have some ideas as to how you could run your own data science experiment.
===
If you enjoyed this post that featured a sliver of what you can begin to do with Twitter data, you may also enjoy the broader story of social web mining as chronicled in a 400+ page book that’s designed to be the “premium support” for the open source project that’s on GitHub. You can purchase the DRM-free ebook directly from O’Reilly and receive free updates for life.
Read more about the journey of authoring Mining the Social Web, 2nd Edition and how I tried to apply lean practices to make it the best possible resource for mainstream data mining in Reflections on Authoring a Minimum Viable Book.
What Are People Tweeting About #Syria in Your Neck of the Woods?
Posted on September 4, 2013 2 Comments

Update: Sept 9, 2013 – View Surprising Stats From Mining One Million Tweets About #Syria for a more comprehensive analysis of content in this post.
In the opening chapter of Mining the Social Web, 2nd Edition we begin the journey into mining social data by way of Twitter. To paraphrase some of the content from an early section entitled “Why Is Twitter All the Rage?”, I remind us that technology must amplify a meaningful aspect of our human experience in order to be successful, and Twitter’s success largely has been dependent on its ability to do this quite well. Although you could describe Twitter as just a “free, high-speed, global text-messaging service,” that would be to miss the much larger point that Twitter scratches some of the most fundamental itches of our humanity:
- We want to be heard
- We want to satisfy our curiosity
- We want it easy
- We want it now
…technology must amplify a meaningful aspect of our human experience in order to be successful…
In this short blog post, I’ll demonstrate how you could use the tools and example code from the book to very quickly answer the question, “What are people tweeting about #Syria in your neck of the woods?” in order to craft an interactive visualization for exploring a compelling set of data. Think of this post as the first in a series that’s designed to introduce example code to help you satisfy three of the four items on the list. It’ll then be up to you if you’d like to satisfy the fourth item (to be heard) by sharing the insights that you discover with others.
In addition to an introduction for mining Twitter data that’s presented in Chapter 1, a cookbook of more than two dozen recipes for mining Twitter data is featured in Chapter 9. The recipes are fairly atomic and designed to be composed as simple building blocks that can be copied, pasted, minimally massaged in order to get you on your way. (In a nutshell, that’s actually the purpose of the entire book for the broader social web: to give you the tools that you need to transform curiosity into insight as quickly and easily as possible.)
In this post, we’ll adapt concepts from three primary recipes:
- Accessing Twitter’s API for Development Purposes (Example 9-1)
- Saving and Accessing JSON Data with MongoDB (Example 9-7)
- Sampling the Twitter Firehose with the Streaming API (Example 9-8)
You can review these short examples in the nicely rendered IPython Notebook for all of the finer details, but the combined approach is pretty simple: let’s use Twitter’s Streaming API to store away a collection of tweets containing #Syria. Although there is a little bit of extra robustness you may want to add to the code for certain exceptional circumstances, the essence of the combined recipes is quite simple:
import twitter
import pymongo

# Our query of interest
q = '#Syria'

# See Example 9-1 (Accessing Twitter's API...) for API access
twitter_stream = twitter.TwitterStream(auth=twitter.oauth.OAuth(...))

# See https://dev.twitter.com/docs/streaming-apis for more options
# in filtering the firehose
stream = twitter_stream.statuses.filter(track=q)

# Connect to the database
client = pymongo.MongoClient()
db = client["StreamingTweets"]

# Read tweets from the stream and store them to the database
for tweet in stream:
    db["Syria"].insert(tweet)
In other words, you just filter the public stream for a search term and stash away the results to a convenient storage medium like MongoDB. It really is that easy! Over the past 72 hours, I’ve collected just over 500,000 tweets using exactly this approach, and you could do the very same thing for any particular topic of interest.
As discussed at length in Chapter 1, there is roughly 5KB of metadata that accompanies those 140 characters that you commonly think of as a tweet, and among the metadata fields are geo-coordinates. Although the percentage of Twitter users who have geo-coordinates enabled for their tweets has consistently been less than 1% in my own experience, that’s still plenty of data points out from our collection to plot on a map and explore.
…there is roughly 5KB of metadata that accompanies those 140 characters that you commonly think of as a tweet…
The minutia of running a MongoDB query to parse out the geo-coordinates along with a couple of other convenient fields to support the visualization such as the tweet’s id, text, and author is fairly uninteresting and won’t be repeated here. Suffice it to say that you can rather trivially munge the format of your data in just a few lines of additional code and export it to an exciting new format called GeoJSON that is both convenient and portable. As it turns out, GitHub automatically provides a terrific GeoJSON visualization for any GeoJSON file that’s checked into a repository or stored as a gist.
Without further delay, click on the screenshot below to try out the interactive visualization, and note also that you can click on the styling markers to view the referenced metadata.

Click on a style marker to view the pertinent metadata details about the tweets that power this visualization. The blue circles represent clusters of style markers. Click on blue circles to zoom in and reveal additional style markers.
Bearing in mind that the results that we have collected represent up to 1% of the firehose, we do see tweets all over the map with higher concentrations in certain parts of the world that have been routinely making headlines such as the Unites States and Great Britain. Do you see anything that surprises you by perusing the tweets? Are the tweets from your “neck of the woods” similar to your own sentiments about the political situation?
Although we could have opted to use other recipes in the cookbook to just search for the most recent tweets about #Syria within a given locale, we wouldn’t have been able to as easily explore a sample of worldwide tweets about #Syria on a map using this approach. However, searching for tweets within a particular area once you’ve identified a locale of interest is exactly what you’d want to do in order to exploit some portion of the data. For example, you might wonder what the sentiment is on the western coast of Africa regarding #Syria and zoom in on that content for closer review. Perhaps this is something that you’d like to see in the next post?
Thanks for reading. I hope you’ve enjoyed and adapt the sample code to transform your curiosity into great insights about the world around us.
If you’ve enjoyed this content, you may want to tweet about it using the blog’s sidebar widget or consider purchasing a copy of Mining the Social Web, 2nd Edition, which is in its final stages of production. (I recommend the DRM-free ebook, which is already available as an “Early Access” product, but paper copies should be available in approximately one month as well.)
===
Read more about the journey of authoring Mining the Social Web, 2nd Edition and how I tried to apply lean practices to make it the best possible product for you in Reflection on Authoring a Minimum Viable Book.
An entire chapter featuring GitHub was added to Mining the Social Web, 2nd Edition that’s devoted to mining GitHub data because it is quickly becoming one of the most mainstream hubs for collaboration anywhere on the social web.
Reflections on Authoring a Minimum Viable Book
Posted on August 24, 2013 4 Comments

As the production of the second edition of Mining the Social Web nears completion with an estimated publishing date of mid-September 2013, I wanted to share some thoughts and reflections on what it has been like to write and then (mostly) re-write and re-launch a book. Like anything else, there’s always a backstory, and this post is an abridged version of that backstory that I hope you enjoy.
The First Edition: Two Years of Lessons Learned
I spent the vast majority of my night and weekends during 2010 authoring Mining the Social Web, and it officially debuted at the inaugural Strata Conference in February 2011. At the time, I was quite happy with the book. I had managed to demonstrate how to collect and analyze disparate data from popular social websites in ways that could be used for business intelligence using what seemed to be a fairly accessible toolchain. Moreover, all of the source code for the first edition was hosted at GitHub, which believe it or not, was a bit of an innovation at the time. (The source code for the second edition is managed in a separate GitHub repository.)
Each example listing in the first edition has a hyperlink to the hosted source file, which allows (ebook) readers to trivially navigate from the book to the latest up-to-date bug-fixed code. From there, the reasoning was that they could easily pull down the entire repository and execute standalone scripts for each example. In general, this approach seems to have worked well, although I had overestimated the number of ebook readers compared to paperback readers.
One particular consequence is that since paperback readers tended not to go to the URLs in the example captions since it involved considerably more effort than just clicking a link. As a result, it wasn’t always obvious to them that the latest code fixing Twitter APIs changes (to name one common source of strife) were already available. On more than one occasion, I received a negative review from a reader about how the content that they had just purchased was obsolete even though updates to the latest code had been in place for months. One of the key lessons learned here is that the content in the printed book should have been more regularly updated as opposed to assuming that all readers would take advantage of the GitHub repository. After all, introducing GitHub as a common medium for managing a book’s source wasn’t and still isn’t as normative as I hope it will soon be.
Without getting into all of the other details, it simply turned out to be the case that I’d expected my readers to go to far too much trouble to enjoy the book. Even though my intentions were to originally write a how-to manual on social web mining targeted primarily for software developers, I’d inadvertently tailored the content for a particular niche audience of mostly Linux and Mac OS X developers who were familiar with Python toolchains and could wade through installing and configuring some fairly complex software dependencies and generally make their way around a terminal environment to troubleshoot problems.
One of the primary consequences of the assumptions I’d made is that I’d effectively limited (and frustrated) much of my readership by relegating Windows users to a kind of second-class “you are mostly supported and smart enough to figure it out own your own” status. Check the stats sometime. Regardless of your personal preferences, Windows users still constitute the vast majority of the desktop/laptop market. Treat them with second-class status at your own risk.
…Windows users still constitute the vast majority of the desktop/laptop market. Treat them with second-class status at your own risk…
To sum a lot of this up, I’d done my best to keep the GitHub repository up-to-date with code fixes and completed a couple of significant revisions to the text itself to keep it relevant, but I’d done little else to help myself with the first edition of Mining the Social Web. In hindsight, I was more or less treating the book as a static product and could have taken a much more proactive stance toward improving it with customer feedback as part of a continuous cycle driven by customer feedback.
Late last year as v1.1 of Twitter’s API approached and menaced me with widespread breakage of code examples across three chapters, I committed to start applying lean to the task of producing a second edition. What I thought would be a series of light revisions and a new chapter later proved to be a much more arduous task that once again consumed the majority of my nights and weekends across the first half of this year. The primary difference this time around, however, that I was working smarter.
The Second Edition: Build-Measure-Learn
Although I was (and still am) proud of what I had accomplished with the first edition of Mining the Social Web, a lot has changed over the past ~2.5 years that presents the opportunity for me to release a new edition that is superior to the original in nearly every single way. Having learned a lot about the lean startup over the past year or so, I committed early this year to apply the the lean principle of build-measure-learn to the task of producing a second edition. It’s still early, but the continuous cycle of gathering feedback, measuring it, and learning from it seems to have made a critical difference.
Any book, including a book about technology, needs to tell an entertaining story to be successful, and if the reader isn’t learning and having some fun along the way, it’s hard to imagine that you’ll enjoy very much success as an author. For a technology book like Mining the Social Web, I tend to think of the ability to seamlessly follow along with the code examples as you read the book as one of the most critical components of the user experience for the book. Just like anything else, a poor user experience will result in a poor product regardless of good (you think) the product really is.
…Any book, including a book about technology, needs to tell an entertaining story to be successful…
Two of of the more notable developments in technology that have impacted the user experience for the second edition of Mining the Social Web are Vagrant and IPython Notebook. Vagrant is essentially a way to box up a development environment and distribute it, and IPython Notebook is an interactive browser-based client for Python (and other programming languages) that lowers the bar for conducting and sharing data science experiments. It might be helpful to think of it this way:
- Vagrant provides a virtualized server environment (and is configured with all of the necessary dependencies that you’ll need so that you don’t have to configure/install them yourself)
- IPython Notebook provides a web application running on that server and provides your user interface for Python programming.
The net benefit to the reader is that these two collective innovations trivialize the effort required to run the code examples. While each of these technologies are powerful independent of one another, there is a synergy between them that makes the total greater than the sum of the parts, and I have been calling that collective synergy the “virtual machine experience” for Mining the Social Web. Let’s consider each of these items in more detail.
UX Improvement #1: Configuration Management (Vagrant)
Whereas the first edition of Mining the Social Web included a GitHub repository that I tried to keep up to date, it had no configuration management at all and did nothing at all to ease the pains involved in configuring and installing software across multiple versions of platforms. Even though the example code was almost completely Python, it’s wasn’t trivial to get all of the third-party package dependencies installed even if you were a Python developer. The inclusion of multiple database technologies and their own third-party add-ons only made matters worse in some circumstances. In retrospect, there was just too much disparate technology crammed into the book, and none of it was being properly handled with configuration management.
Applying lean practices, I’ve parsed the feedback, generalized some patterns, and very actively solicited feedback from early readers and reviewers while working on the second edition as part of trying to develop a “minimum viable book.” All of the source code is still managed at GitHub, but included with the source code is configuration management software that bootstraps a virtual machine, which guarantees that all of your software dependencies will be versioned and installed appropriately. Effectively, this allows me as an author to control the user experience for readers and all other consumers of the code who choose to use the virtual machine.
There is minimal effort required to activate and manage the virtual machine, and in addition to writing an appendix describing the few steps involved, I’ve also produced a ~3 minute screencast that visually steps through the process that you might enjoy watching:

A ~3 minute screencast on installing a powerful toolbox for social web mining. View a collection of all available screencasts at http://bit.ly/mtsw2e-screencasts
The goal is simple: anyone on any platform should be able to install the virtual machine. No advanced skills should be required; just point and click. To be perfectly clear with a concrete example: a user who has never worked with developer tools, typed in a terminal, or even programmed before should be able to follow the instructions and be on equal footing with an advanced software developer who can wade through all of the idiosyncrasies in setting up a development environment.
…The goal is simple: anyone on any platform should be able to install the virtual machine…
UX Improvement #2: Graphical User Interface (IPython Notebook)
Just providing a Vagrant-backed virtual machine would be an innovation for a tech book in and of itself, and while it does provide a better user experience for the reader of a book (as I’ve framed it), the innovations stop once the virtual machine is installed. At that point, the reader has everything that is needed to start running the code, but nothing has been done to decrease the friction involved with actually running the code or authoring new code. Even with a terrific virtual machine, the reader is still expected to use SSH to login to the virtual machine and start a Python interpreter session in a terminal. Given that everything has been mostly “point and click” up to this point, why begin re-introducing aggressive assumptions about reader’s skills by beginning to work exclusively with a command line interface again?
Fortunately, IPython Notebook is effectively just a web application, and once your virtual machine is up and running, you just point the same browser that you use for everything else to http://localhost:8080, and it presents all of the source code for the book and the power of the full Python interpreter. You just select the chapter you want to work with, and from there, it is little more than “point and click” to follow along and execute the provided code, author new code, copy and paste examples to compose new programs, and otherwise do whatever you’d like with the full power of the Python interpreter.

The IPython Notebook Dashboard provides access to all of Mining the Social Web’s example code as a useful starting point for data science experiments in social web mining

Executing the code examples is usually as easy as “point and click”
I can’t think of a better way to motivate someone to program or learn more about data science than to give them a powerful development environment with a user interface like IPython Notebook as an interface. It provides turn-key starting templates for mining social data and allows a person to see the results of data science experiments before they necessarily even understand all of the nuts and bolts that are involved…and that’s the beauty of it.
After all, isn’t something like that what we were all drawn towards when we first wanted to become scientists or engineers or programmers in the first place? It was the awe of seeing some phenomenon that we didn’t fully understand but thought it was so amazing that we wanted to commit to learn more about it. That’s where the digging in and learning began…
The GitHub source code repository for the second edition provides good instructions on getting started if you’d like to pull down the project and see all of this for yourself.
Closing Remarks
The virtual machine experience for Mining the Social Web is a powerful concept and raises the bar for just about any tech book involving code examples. However, it does require change to existing patterns of behavior since many readers may resist using it at first, positing that it might be more trouble than it’s worth to get installed. The current bet I’m making is that short ~3 minute screencasts will largely mitigate those kinds of concerns as well as provide an ample demonstration of what is possible to accomplish with the virtual machine and motivate adoption.
We will never become a society of programmers with development environments, and requiring users to have a development environment or even think in terms of a development environment is a sure way not to bring social web mining to the masses. What society really needs is a product that enables a mere mortal to transform curiosity about their social data into insights as easily as a person can currently interrogate the web with a document-oriented keyword search.
…What society really needs is a product that enables a mere mortal to transform curiosity about their social data into insights…
Admittedly, the virtual machine experience that I’m providing with Mining the Social Web is a development environment and is not the product I am alluding to. However, it’s a step in the right direction — the current incarnation of a certain minimum viable product — and I believe that it has the potential to significantly decrease the friction involved in conducting data science experiments and be an enabler of innovation and education in this space. Products built on top of it or an environment like it are sure to follow once a budding entrepreneur identifies the right problem and bolts a sufficient user experience on top of it.
